Specialist Biomedical Scientist Dan Kelly looks into linear calibration curves, Beer-Lambert’s law and IQC interpretation.

In the clinical biochemistry laboratory, it is important to appreciate and understand the fundamental principles of calibration curves and how to interpret results, as the quality of these determine whether IQC values pass or fail internal rules set by the laboratory.
Two-point linear calibration curves are the most commonly used type of calibration for spectrophotometric methods in the biochemistry laboratory. These calibrations typically use a blank and a known concentration of high standard to construct a straight calibration curve that is subsequently used to calculate the unknown concentration of samples. These linear curves are mathematically determined by Beer-Lambert’s law, this law describes the relationship between the absorbance (A), and three independent variables: molar absorptivity (e), path-length (l), and concentration (c). The law takes the form of y=mx+b, where m is the slope or gradient, b is the y intercept, y is the absorbance and x is the concentration. Thus, Beer-Lambert’s law describes the linear relationship between absorbance and concentration of an absorbing species, and is mathematically written as: A=exlxc.
The relationship between a calibration curve and IQC values are fundamentally important in clinical biochemistry. Deviations in the calibration curve can significantly affect IQC values observed by the laboratory, it is here where skilled interpretation and understanding is needed. When a poor calibration has been performed the calibration correction factor (CF) values change causing significant changes in the calculation of unknown samples. The CF value is the number added to the initial value so a true value is calculated. As such, during analysis the absorbance of an unknown sample is multiplied with the factor for result calculation.
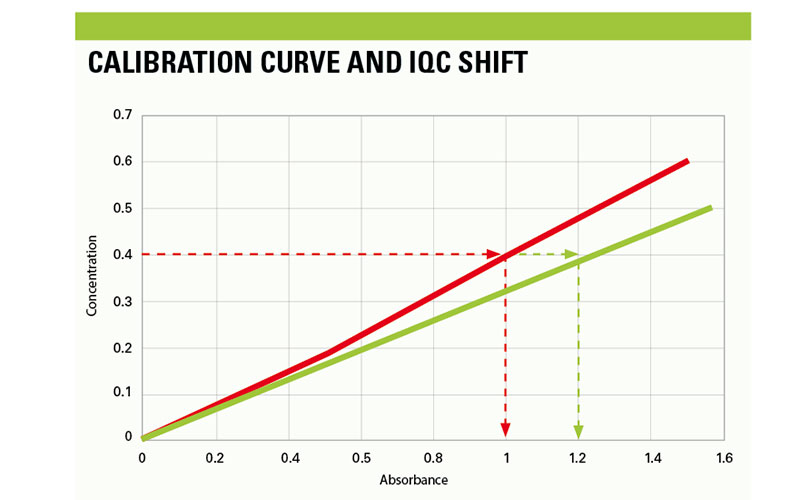
Significant calibration changes cause substantial shifting of IQC values that span the linearity of the assay, and are associated with positive or negative shifting when observed on the Levey-Jennings plot, depending on how the curve has drifted. However, when subtle calibration changes occur and the trajectory of the curve has changed, this is where interpretation of IQC errors is fundamentally important in analytical chemistry. An example of such calibration change is highlighted in figure 1. The calibration highlighted in Red is a passed calibration curve for an assay that conforms to the standard values provided by the manufacturer. This curve has the correct trajectory that can accurately calculate the concentration of the unknown using Beer-Lambert’s law. The concentration of the IQC is 0.4 that should produce absorbance values of 1.0, arbitrary values.
Conversely, the calibration curve in blue is an example of an incorrect calibration, this curve is spanning the linearity of the assay at a lower gradient, which will cause a deviation in the calculation of the unknown. The CF values have shifted significantly when compared to previous values; which has caused an upward shift in the IQC data. Subsequently, the same IQC material will produce absorbance results of 1.2. As displayed, the same material can produce different results when the calibration curve has shifted slightly. This example can be applied for calibration curves that have shifted at a steeper gradient, which will produce IQC results that are lower than set target ranges.
Calibration shifting mentioned in the example may be due to a number of factors that influence assay performance, such frequent examples include: incorrect reconstitution of calibration standard material, old calibrator material that has deteriorated, contamination, inherent analytical issues, reagent performance issues. As an analytical chemist, it is important to note that excessive calibration frequency causes erratic IQC values and this practice should be avoided. It is important, therefore, to review calibration curves appropriately when investigating IQC shifts. Reviewing and interpretation of data should be commonly employed in the clinical chemistry laboratory to ensure patient results are being reported accurately. Significant changes in calibration curves cause substantial changes to IQC values that are easily recognised. However, when subtle shifts in calibration data slightly alter the trajectory of the curve there is a modest shift in IQC data. It is here where a review of CF values and calibration history may be needed to determine the cause of a QC failure.
Dan Kelly is a Specialist Biomedical Scientist, working in clinical biochemistry at Leeds General Infirmary.
Image Credit | iStock